Tech Note: SARS-CoV-2 Illumina Sequencing
In order to provide genome sequencing of SARS-CoV-2 samples for research groups working with the NGI, we tested a new commercially available kit using multiplexed amplicons.
Introduction
In order to provide genome sequencing of SARS-CoV-2 samples for research groups working with the NGI, we tested a new commercially available kit using multiplexed amplicons. The kits is made by Swift aims to tile primer pairs across the viral genome to give complete genome coverage. The benchmark uses synthetic RNA controls with known sequence at two different concentrations (dilutions with 1 part in 10 thousand or 1 part in 1 million) and runs samples in triplicate.
Experimental setup
Library prep kit
The kit used is called the “Swift Normalase Amplicon SARS-CoV-2 NGS Panels (SNAP)”. The product web page can be found here: https://swiftbiosci.com/swift-normalase-amplicon-sars-cov-2-panels/
There are multiple primer panels available: SARS-CoV-2 Panel and the SARS-CoV-2 Additional Genome Coverage Panel. We are using the former – it’s the smaller and older version and was the only version available at time of purchase.The primer information is held within a file called swift_sarscov2_panel_masterfile2.xlsx and describes the 682 primers supplied in the kit.
Test samples
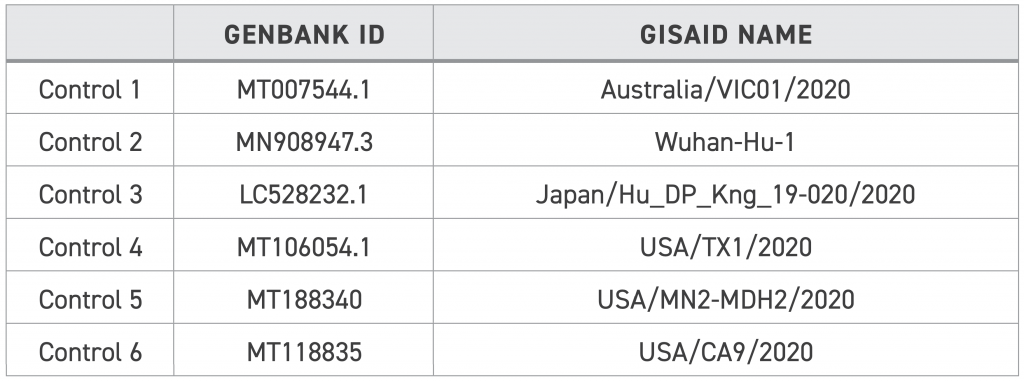
The following Twist Synthetic SARS-CoV-2 RNA Controls were used:
MN908947.3(GISAID:Wuhan-Hu-1)MT106054.1(GISAID:USA/TX1/2020)
See the Twist product sheet for more details. The key figures from this product sheet are as follows:
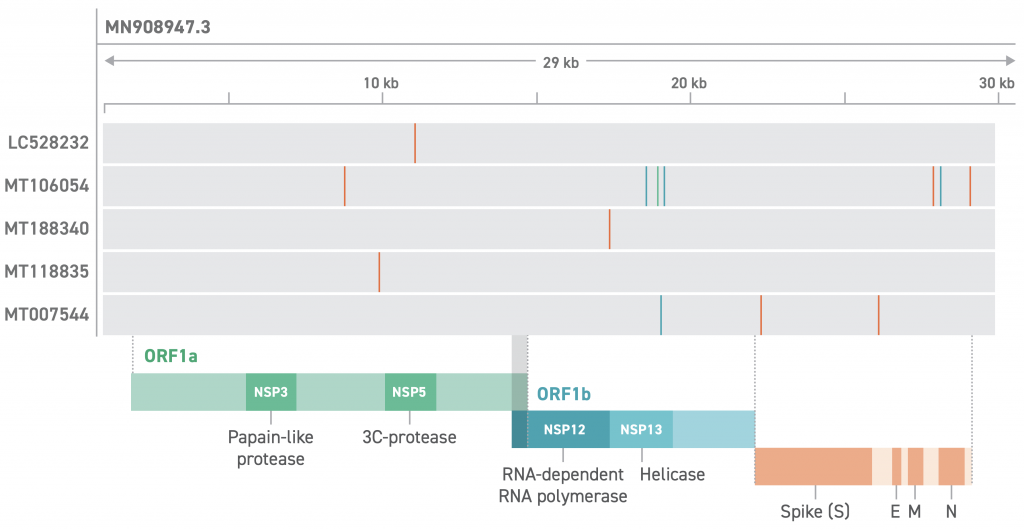
As such, we know what variants we expect to see against the MN908947.3 background:
MN908947.3vsMN908947.3(itself) – no variantsMN908947.3vsMT106054.1– seven variants
MN908947.3 is the same isolate and identical sequence as accession NC_045512.2 – this was one of the first available genomic sequences and is commonly used as a reference genome for SARS-nCoV-2 analysis. As such, this synthetic RNA should give no variants in the analysis.
The experiment was set up with the following sample IDs and names:
P18658_1001– Control #2 R1 1000000P18658_1002– Control #2 R2 1000000P18658_1003– Control #2 R3 1000000P18658_1004– Control #2 R1 10000P18658_1005– Control #2 R2 10000P18658_1006– Control #2 R3 10000P18658_1007– Control #4 R1 1000000P18658_1008– Control #4 R2 1000000P18658_1009– Control #4 R3 1000000P18658_1010– Control #4 R1 10000P18658_1011– Control #4 R2 10000P18658_1012– Control #2 R3 10000
Control #2 and #4 refer to the input RNA used. R1, R2 and R3 refer to a replicate number as the samples were run in triplicate. The final number refers to the dilution used: 1 in 10k or one in 1 million.
Note: I assume that Control #2 R3 10000 is mislabelled and should instead read Control #4 R3 10000.
Analysis methods
Reference genome
The nf-core/viralrecon pipeline was used with reference genome NC_045512.2, with files GCF_009858895.2_ASM985889v3_genomic.200409.fna.gz and GCF_009858895.2_ASM985889v3_genomic.200409.gff.gz as supplied by the nf-core/configs and nf-core/test-datasets repositories.
With help from Chris Fields at the University of Illinois I collected the required files for the primer sequences for the Swift kit to run nf-core/viralrecon – a NC_045512.2.primers.bed and NC_045512.2.primers.fna file. These files are based on the masterfile of Swift primer sequences.
Pipeline run
I ran nf-core/viralrecon version 1.1.0 with the following Nextflow config:
params {
    input = "samplesheet.csv"
    save_kraken2_fastq = true
    protocol = "amplicon"
    amplicon_bed = "ref/NC_045512.2.primers.bed"
    amplicon_fasta = "ref/NC_045512.2.primers.fna"
    genome = "NC_045512.2"
    amplicon_left_suffix = "F"
    amplicon_right_suffix = "R"
    kraken2_db = "ref/kraken2_human.tar.gz"

    // Genome reference file paths
    genomes {
        'NC_045512.2' {
            fasta = "ref/GCF_009858895.2_ASM985889v3_genomic.200409.fna.gz"
            gff   = "ref/GCF_009858895.2_ASM985889v3_genomic.200409.gff.gz"
        }
    }

    project = "ngi2016004"
    clusterOptions = null
    max_memory = '250.GB'
    igenomes_base = "/sw/data/uppnex/igenomes/"
}
process {
    container = "../nfcore-viralrecon-1.1.0.img"
}
The pipeline was launched with the following command:
nextflow run ../nf-core-viralrecon-1.1.0/workflow -profile uppmax
The sample sheet was prepared with the pairs of FastQ files listed for the project samples above, with no duplicate sample IDs (no merging).
Results
Sequence QC and alignment
The data appear to be of excellent quality. There was nothing of note in the raw read QC other than things that are to be expected such as slightly spiky GC content and a large amount of sequence duplication. Moderate adapter sequence contamination was found in some samples, but at an acceptable level – under 15% of sequences affected from around 40bp onwards in the reads.
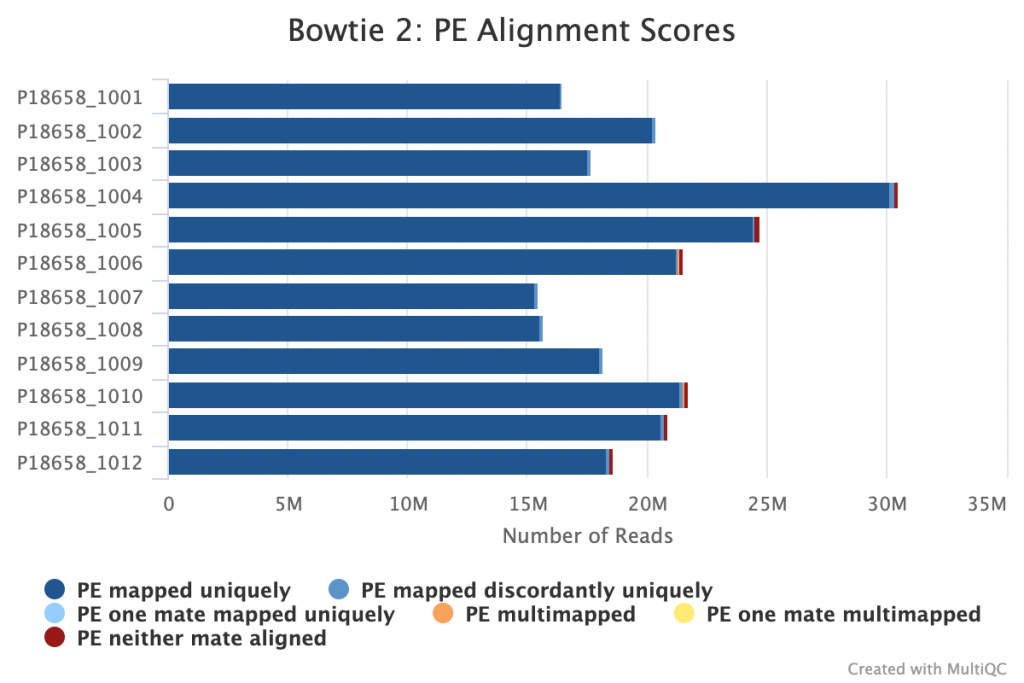
Alignment was also excellent, with essentially 100% alignment rate against the viral genome:
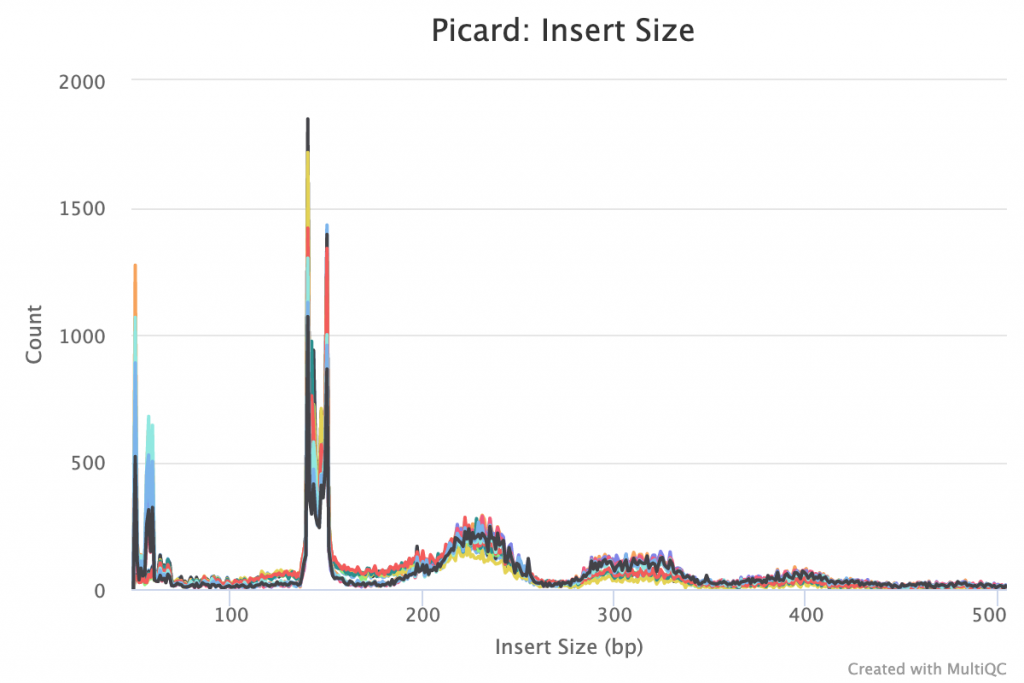
Amplification performance
The insert size plot from Picard shows peaks at around 50bp, 57np, 59bp, the large doublet spike at 140-150bp and small broader peaks at ~250bp, 310bp and 400bp.
The following heatmap shows the performance of every PCR primer pair against each sample (see full PDF):
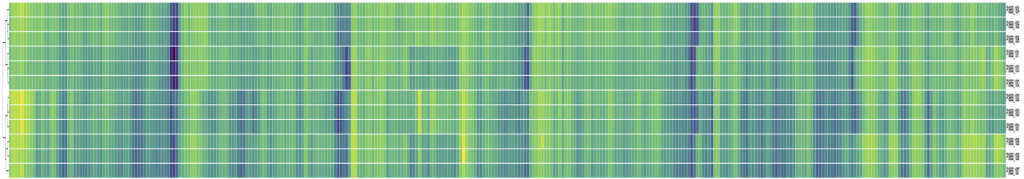
Columns are primers and each row is a sample. Samples cluster according to the quantity of input material, as expected. However, there do not seem to be any huge variations in performance across samples. Some variation across primers is seen, but it is difficult to assess how much of a problem this is and should probably be expected.
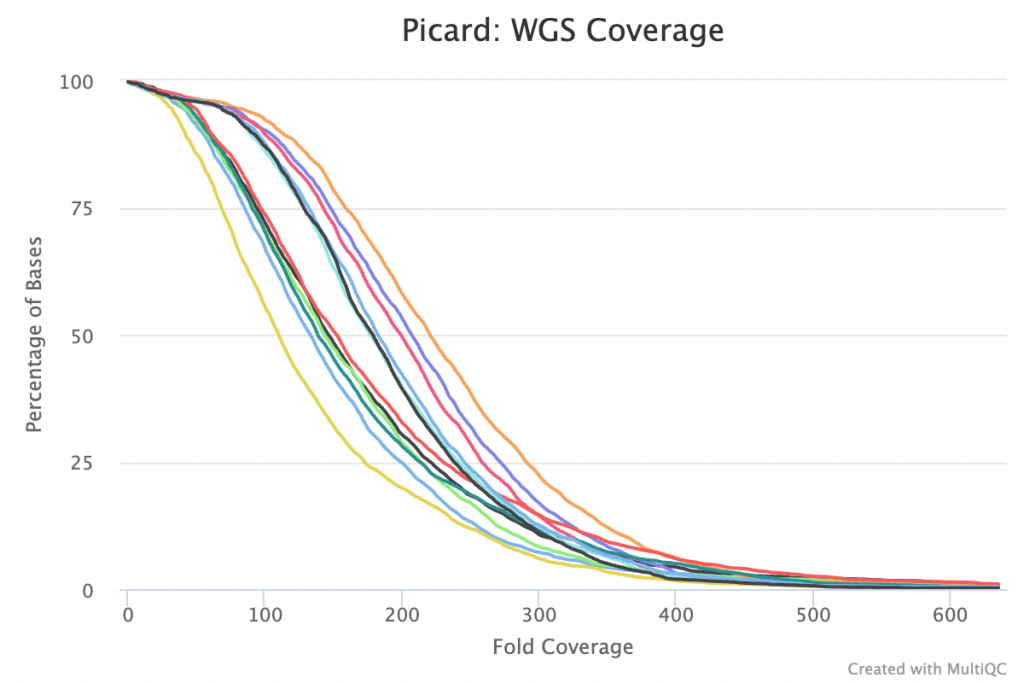
Genome coverage appears relatively consistent across all samples with smooth curves, suggesting even coverage:
Variant calling
The nf-core/viralrecon pipeline does variant calling using three different tools: VarScan 2, iVar and BCFTools. All three tools found seven high confidence SNPs in Control #4 and 2 of the 3 tools found no SNPs in Control #2. (It seems to be the case the BCFTools generally reports more spurious calls).
Sample Control #4 is synthetic RNA MT106054.1 which has seven SNPs expected. Control #1 should not have had any SNPs. This matches what we see in the table below:
| # High conf SNPs | # High conf INDELs | |||||
|---|---|---|---|---|---|---|
| Sample | VarScan 2 | iVar | BCFTools | VarScan 2 | iVar | BCFTools |
| Control #2 R1 1000000 | 0 | 0 | 1 | 0 | 0 | 0 |
| Control #2 R2 1000000 | 0 | 0 | 1 | 0 | 0 | 0 |
| Control #2 R3 1000000 | 0 | 0 | 1 | 0 | 0 | 0 |
| Control #2 R1 10000 | 0 | 0 | 0 | 0 | 0 | 0 |
| Control #2 R2 10000 | 0 | 0 | 0 | 0 | 0 | 0 |
| Control #2 R3 10000 | 0 | 0 | 0 | 0 | 0 | 0 |
| Control #4 R1 1000000 | 7 | 7 | 7 | 0 | 0 | 1 |
| Control #4 R2 1000000 | 7 | 7 | 7 | 1 | 1 | 1 |
| Control #4 R3 1000000 | 7 | 7 | 7 | 0 | 0 | 1 |
| Control #4 R1 10000 | 7 | 7 | 7 | 1 | 1 | 1 |
| Control #4 R2 10000 | 7 | 7 | 7 | 1 | 1 | 1 |
| Control #2 R3 10000 | 7 | 7 | 7 | 1 | 1 | 1 |
Note: I assume that the final Control #2 R3 10000 sample is mislabelled and should be Control #4.
Variant locations
Viewing the VCF files (variant call files) in IGV, we can see that their locations seem to match perfectly with the Swift product sheet image above:

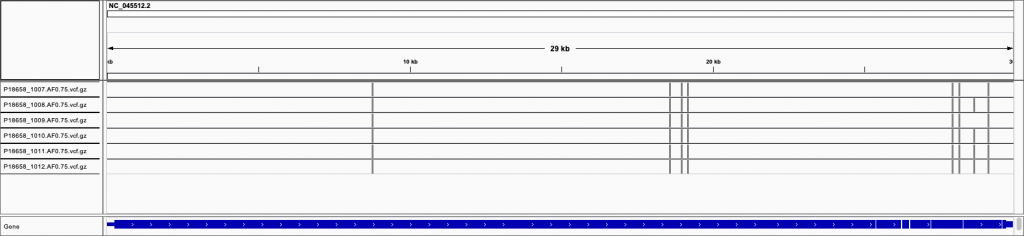
The only difference is the extra INDEL on the right hand side for some samples, which is a single base deletion.
Conclusion
In summary, the Swift kit seems to have worked almost flawlessly. The correct SNPs were detected and the samples were clean. Nothing out of the ordinary was really noticed, and there was very little difference between the two dilutions meaning that it should be suitable for low-input samples.
Last Updated: 3rd March 2021