Spatial Transcriptomics analysis
Demultiplexing, image alignment, read alignment and barcode/UMI counting of sequencing reads generated by the 10X Genomics Visium assay.
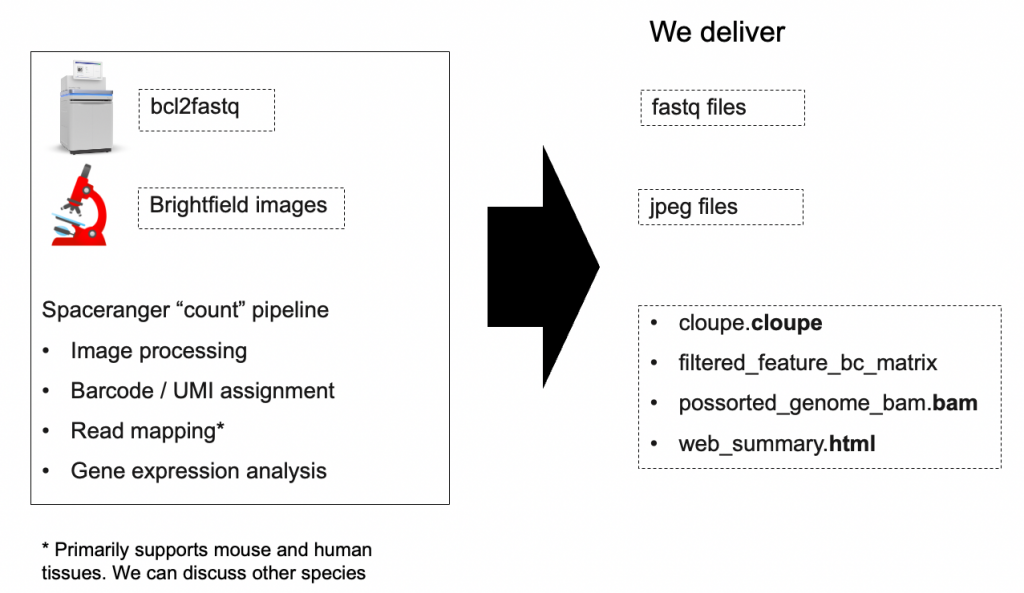
The Spaceranger pipeline processes spatially barcoded RNA-seq data together with brightfield images to align sequencing reads, generate gene-spot matrices and to give spatial context to spot data on the tissue image.
When we run analysis
We run this analysis for 10X Visium projects.
Input data
- Spaceranger-compatible fastQ files generated by bcl2fastq
- Brightfield tissue image
- (Optionally, if needed) Manual brightfield tissue image alignment in Loupe
Results
The pipeline generates standard BAM, MEX, CSV, HDF5, TIFF, PNG, JPEG and HTML files that are augmented with spatial information. These files also include QC metrics that inform of the overall success of the spatial transcriptomics experiments.
For further analysis, visualization, and integration of spatial datasets we suggest any of the following packages:
R
Python
Last Updated: 22nd January 2026